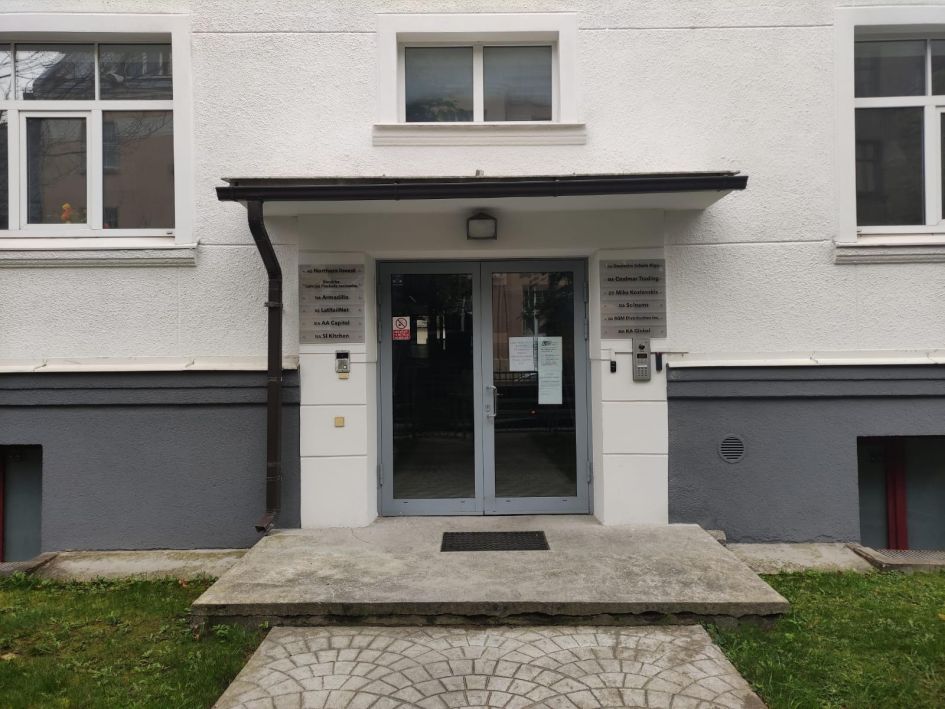
Table
1. Gross domestic product (GDP)
Table 2. Expenditure of the General
Government Consolidated Budget (per cent)
Table 3. Monthly average gross wage per
sections
Table 4. Population (at the beginning of
the year )
Table 5. Natural increase per 1000
population
Table 6. Population of working age (at the
beginning of the given year)
Table 7. Population forecast by age and
gender till 2025 (Medium variant)
Table 9. Economic activity rate by gender
and educational attainment, November, 2000, 2001, in %
Table 10. Employment structure by sections
of economy (per cents of total)
Table 11. Registered unemployment and
unemployment by Labour Force Survey
Table 13. Share of registered unemployed by
educational attainment, %
Table 14: Education institutions: number
and enrolment (1990 –2001)
Table 15: Selected educational indicators
Table 16: Teaching staff of
vocational schools at the begining of academic year
Table 18:Discharged from secondary
education
Table 20: Enrolment in education/training
between 14 and 25
Table 21. The expenditures of special
employment budget (millions LVL)
Table 22. The number of persons receiving
unemployment benefit and average amount of it
Table 23. The mandatory contribution
payment rates by the kind of state social insurance
Table 24. The unemployment benefits
Table 25: Annex 1 Conception of Education
Development 2002—2005
ANNEXES
|
Year |
GDP, thousands LVL, (at average prices of 2000) |
As per cent of previous year (at constant
prices) |
GDP, thousands LVL, at current prices |
GDP per capita, converted in |
|
1990 |
6,319,063 |
|
62,440 |
|
|
1991 |
5,523,163 |
|
143,325 |
|
|
1992 |
3,749,202 |
|
1,004,552 |
|
|
1993 |
3,321,340 |
|
1,467,014 |
|
|
1994 |
3,394,074 |
|
2,042,555 |
|
|
1995 |
3,361,988 |
|
2,329,418 |
|
|
1996 |
3,485,728 |
103.7 |
2,807,284 |
|
|
1997 |
3,777,708 |
108.4 |
3,269,498 |
5230 |
|
1998 |
3,957,451 |
104.8 |
3,592,157 |
5620 |
|
1999 |
4,069,798 |
102.8 |
3,889,658 |
6070 |
|
2000 |
4,348,340 |
106.8 |
4,348,340 |
6990 |
|
2001 |
4,682,442 |
107.7 |
4,758,647 |
7710 |
Source: Statistical Yearbook
of Latvia, 2002. - CSB. Riga, 2002.
|
|
1998 |
1999 |
2000 |
2001 |
||||
|
|
structure |
Of GDP |
structure |
Of GDP |
structure |
Of GDP |
structure |
Of GDP |
|
Expenditure – total |
100 |
43.8 |
100 |
44.8 |
100 |
40.2 |
100 |
37.8 |
|
General public services |
9.1 |
4.0 |
7.7 |
3.5 |
7.2 |
2.9 |
7.7 |
2.9 |
|
Defence |
2.4 |
1.0 |
2.2 |
1.0 |
2.3 |
0.9 |
2.6 |
1.0 |
|
Public order and safety, law
enforcement |
5.8 |
2.6 |
6.7 |
3.0 |
6.4 |
2.6 |
|
|
|
Education |
15.7 |
6.9 |
15.1 |
6.7 |
16.9 |
6.8 |
18.5 |
6.9 |
|
Health care |
9.4 |
4.1 |
9.1 |
4.1 |
8.8 |
3.6 |
9.1 |
3.4 |
|
Social security and welfare |
34.4 |
15.1 |
35.9 |
16.1 |
35.3 |
14.2 |
34.3 |
13.0 |
|
Housing and community amenity,
environmental protection |
5.5 |
2.4 |
4.5 |
2.0 |
5.3 |
2.1 |
5.9 |
2.2 |
|
Recreation, sport, culture,
religion |
2.8 |
1.2 |
2.9 |
1.3 |
3.4 |
1.4 |
3.5 |
1.3 |
|
Agriculture, forestry, fishing |
4.6 |
2.0 |
4.7 |
2.1 |
3.9 |
1.6 |
3.7 |
1.4 |
|
Transport, communications |
5.8 |
2.5 |
6.1 |
2.7 |
4.9 |
2.0 |
4.6 |
1.7 |
|
Fuel and energy |
0.3 |
0.1 |
0.2 |
0.1 |
0.1 |
0.0 |
0.1 |
0.0 |
|
Other economic affairs |
1.0 |
0.4 |
1.8 |
0.8 |
2.1 |
0.9 |
1.6 |
0.6 |
|
Other activities not classified in
major group |
3.1 |
1.4 |
3.0 |
1.4 |
3.1 |
1.3 |
2.3 |
0.9 |
Source: Economic Development of Latvia – Riga: Ministry of Economy,
December 2001.
Economic Development of Latvia – Riga: Ministry of Economy, June, 2002.
|
Year |
2000 |
2001 |
||||
|
Total in |
150 |
159 |
||||
|
|
Percent of average wage |
Public sector per cent of total average |
Private sector per cent of total average |
Percent of average wage |
Public sector per cent of total average |
Private sector per cent of total average |
|
Total |
100 |
113 |
91 |
100 |
113 |
92 |
|
Agriculture, hunting, forestry (A) |
77 |
129 |
65 |
75 |
127 |
63 |
|
Fishing (B) |
57 |
71 |
54 |
62 |
70 |
54 |
|
Industry (C+D+E) |
101 |
150 |
95 |
100 |
139 |
95 |
|
Construction (F) |
89 |
135 |
88 |
86 |
121 |
86 |
|
Wholesale and retail trade; repair of motor vehicles, motorcycles and personal and household goods (G) |
72 |
99 |
72 |
74 |
102 |
74 |
|
Hotels and restaurants (H) |
57 |
125 |
52 |
62 |
137 |
59 |
|
Transport, storage, communication (I) |
129 |
143 |
108 |
126 |
137 |
111 |
|
Financial intermediation (J) |
256 |
438 |
235 |
262 |
449 |
240 |
|
Real estate, renting and business activities (K) |
114 |
112 |
115 |
116 |
109 |
120 |
|
Public administration and defence (L) |
132 |
132 |
303 |
131 |
130 |
312 |
|
Education (M) |
90 |
90 |
107 |
96 |
96 |
106 |
|
Health and social work (N) |
83 |
84 |
75 |
83 |
84 |
75 |
|
Other community, social and personal service activities (O) |
86 |
93 |
72 |
87 |
96 |
69 |
Source: Statistical
Yearbook of Latvia, 2002. - CSB. Riga, 2002.
|
|
Resident population |
|||
|
total
|
urban |
rural |
inhabitants
per 1 km2 of total area |
|
|
1986 |
2,587,716 |
1,777,830 |
809,886 |
40.1 |
|
1990 |
2,668,140 |
1,842,317 |
825,823 |
41.3 |
|
1991 |
2,658,161 |
1,837,312 |
820,849 |
41.2 |
|
1992 |
2,643,000 |
1,822,135 |
820,865 |
40.9 |
|
1993 |
2,585,675 |
1,770,847 |
814,828 |
40.0 |
|
1994 |
2,540,904 |
1,750,777 |
790,127 |
39.3 |
|
1995 |
2,500,580 |
1,717,823 |
782,757 |
38.7 |
|
1996 |
2,469,531 |
1,693,507 |
776,024 |
38.2 |
|
1997 |
2,444,912 |
1,677,416 |
767,496 |
37.9 |
|
1998 |
2,420,789 |
1,660,070 |
760,719 |
37.5 |
|
1999 |
2,399,248 |
1,643,447 |
755,801 |
37.1 |
|
2000 |
2,381,715 |
1,621,758 |
759,957 |
36.9 |
|
2001 |
2,364,254 |
1,606,559 |
757,695 |
36.6 |
|
2002 |
2,345,768 |
1,591,986 |
753,782 |
36.3 |
Source: Demographic Yearbook of Latvia 2002 – Riga: CSB, 2002.
|
Year |
Natural increase |
Natural increase per 1000
population |
|||||||
|
|
total |
Births |
deaths |
total |
births |
deaths |
urban
areas |
rural
areas |
|
|
1985 |
5,585 |
39,751 |
34,166 |
2.2 |
15.4 |
13.2 |
|
|
|
|
1990 |
3,106 |
37,918 |
34,812 |
1.1 |
14.2 |
13.1 |
|
|
|
|
1991 |
-116 |
34,633 |
34,749 |
-0.0 |
13.1 |
13.1 |
|
|
|
|
1992 |
-3,851 |
31,569 |
35,420 |
-1.5 |
12.1 |
13.6 |
|
|
|
|
1993 |
-12,438 |
26,759 |
39,197 |
-4.9 |
10.4 |
15.3 |
|
|
|
|
1994 |
-17,501 |
24,256 |
41,757 |
-7.0 |
9.6 |
16.6 |
|
|
|
|
1995 |
-17,336 |
21,595 |
38,931 |
-7.0 |
8.7 |
15.7 |
-7.0 |
-6.7 |
|
|
1996 |
-14,538 |
19,782 |
34,320 |
-5.9 |
8.1 |
14.0 |
-5.8 |
-5.9 |
|
|
1997 |
-14,703 |
18,830 |
33,533 |
-6.1 |
7.7 |
13.8 |
-5.8 |
-6.3 |
|
|
1998 |
-15,790 |
18,410 |
34,200 |
-6.6 |
7.6 |
14.2 |
-6.3 |
-6.7 |
|
|
1999 |
-13,448 |
19,396 |
32,844 |
-5.6 |
8.1 |
13.7 |
-5.5 |
-5.7 |
|
|
2000 |
-11,957 |
20,248 |
32,205 |
-5.1 |
8.5 |
13.6 |
-5.0 |
-5.0 |
|
|
2001 |
-13,327 |
19,664 |
32,991 |
-5.7 |
8.3 |
14.0 |
-5.6 |
-5.9 |
|
Source: CSB data
|
Year |
Population
under working age |
Ratio
to total population, % |
Population
of working age, (thousands) |
Ratio
to total population, % |
|
1986 |
585,341 |
22.6 |
1,477,086 |
57.1 |
|
1991 |
605,471 |
22.8 |
1,500,164 |
56.4 |
|
1992 |
603,318 |
22.8 |
1,475,149 |
55.8 |
|
1993 |
552,434 |
21.4 |
1,465,931 |
56.7 |
|
1994 |
536,331 |
21.1 |
1,435,691 |
56.5 |
|
1995 |
521,877 |
20.9 |
1,411,472 |
56.4 |
|
1996 |
505,896 |
20.5 |
1,413,597 |
57.2 |
|
1997 |
488,993 |
20.0 |
1,401,808 |
57.3 |
|
1998 |
469,672 |
19.4 |
1,391,700 |
57.5 |
|
1999 |
448,063 |
18.7 |
1,404,664 |
58.5 |
|
2000 |
428,082 |
18.0 |
1,402,249 |
58.9 |
|
2001 |
409,760 |
17.3 |
1,424,985 |
60.3 |
|
2002 |
390,478 |
16.6 |
1,425,116 |
60.8 |
Source: Demographic Yearbook of Latvia 2002 – Riga: CSB, 2002.
|
Age groups |
|
0-14 |
15-19 |
20-24 |
25-34 |
35-44 |
45-54 |
55-59 |
60+ |
Total |
|
2005 |
Total |
335,148 |
188,764 |
178,103 |
331,351 |
351,620 |
333,278 |
129,832 |
524,558 |
2,372,654 |
|
|
Males
|
170,563 |
95,856 |
90,015 |
168,152 |
176,193 |
156,926 |
57,715 |
188,219 |
1,103,639 |
|
|
Females |
164,585 |
92,908 |
88,088 |
163,199 |
175,427 |
176,352 |
72,117 |
336,339 |
1,269,015 |
|
2010 |
Total |
285,367 |
150,094 |
188,204 |
337,867 |
337,778 |
346,457 |
151,184 |
518,159 |
2,315,110 |
|
|
Males |
144,084 |
76,532 |
95,245 |
169,987 |
171,447 |
166,017 |
68,280 |
189,616 |
1,081,208 |
|
|
Females |
141,283 |
73,562 |
92,959 |
167,880 |
166,331 |
180,440 |
82,904 |
328,543 |
1,233,902 |
|
2020 |
Total |
310,655 |
92,670 |
87,983 |
338,098 |
334,920 |
326,783 |
165,440 |
554,828 |
2,211,377 |
|
|
Males |
157,019 |
46,358 |
44,189 |
170,847 |
167,297 |
163,052 |
77,888 |
214,537 |
1,041,187 |
|
|
Females |
153,636 |
46,312 |
43,794 |
167,251 |
167,623 |
163,731 |
87,552 |
340,291 |
1,170,190 |
|
2025 |
Total |
293,192 |
102,637 |
93,170 |
239,484 |
366,350 |
319,744 |
157,087 |
584,455 |
2,156,118 |
|
|
Males |
148,401 |
51,475 |
46,489 |
120,749 |
183,157 |
158,185 |
76,449 |
231,997 |
1,016,903 |
|
|
Females |
144,792 |
51,162 |
46,680 |
118,736 |
183,193 |
161,560 |
80,636 |
352,458 |
1,139,216 |
Source: Prognosis of demographic development of Latvia: years
1998-2025. Informative material. Red. P. Zvidrins. Riga: University of Latvia,
1999
|
Economically active population by obtained
education, thousands of population |
|||||||
|
|
ISCED |
total in the country |
males |
females |
|||
|
2000 |
2001 |
2000 |
2001 |
2000 |
2001 |
||
|
Higher |
ISCED
5 |
223,0 |
220,2 |
96,0 |
88,8 |
127,0 |
131,4 |
|
Secondary
incl. secondary vocational |
ISCED 3-4 |
705,4 |
689,9 |
359,0 |
360,1 |
346,4 |
329,7 |
|
Basic |
ISCED 2 |
182,3 |
180,6 |
117,1 |
114,3 |
65,2 |
66,3 |
|
Incomplete
basic |
ISCED 1 |
21,2 |
14,2 |
11,1 |
6,7 |
10,1 |
7,5 |
|
|
|
|
|
|
|
|
|
Source: Labour Force
Surveys: Main Indicators (November 2001) - Central Statistical Bureau of
Latvia. Riga, March 2002.
|
|
Total
in country |
Males |
Females |
|||
|
2000 |
2001* |
2000 |
2001* |
2000 |
2001* |
|
|
Higher |
77.7 |
77.9 |
79.2 |
80.4 |
76.6 |
76.3 |
|
Secondary
incl. secondary vocational |
68.6 |
67.1 |
77.0 |
76.1 |
61.6 |
59.4 |
|
Basic |
36.0 |
36.7 |
46.4 |
47.2 |
25.6 |
26.5 |
|
Incomplete
basic |
12.5 |
9.3 |
18.0 |
12.4 |
9.3 |
7.5 |
Source: Labour force in
Latvia. Labour force survey data, November 2000. A statistical bulletin.
Central Statistical Bureau of Latvia. Riga, March 2001.
Labour Force
Surveys: Main Indicators (November 2001) - Central Statistical Bureau of
Latvia. Riga, March 2002.
* - data is not
comparable with the previous years
|
Sections
of economy |
1996 |
1999 |
2000 |
2001* |
|
|
100 |
100 |
100 |
100 |
|
Agriculture,
hunting, forestry |
17.3 |
14.9 |
13.3 |
14.8 |
|
Fishing |
0.7 |
0.4 |
0.2 |
0.3 |
|
Mining
and quarrying |
0.2 |
0.1 |
0.2 |
0.1 |
|
Manufacturing |
18.3 |
17.7 |
17.7 |
1.1 |
|
Electricity,
gas and water supply |
2.3 |
2.3 |
2.4 |
1.9 |
|
Construction |
5.9 |
5.9 |
6.0 |
7.3 |
|
Trade
and repair |
12.5 |
15.3 |
16.0 |
16.9 |
|
Hotels
and restaurants |
1.6 |
2.2 |
2.4 |
2.0 |
|
Transport,
storage, communication |
8.9 |
8.6 |
8.5 |
8.0 |
|
Financial
intermediation |
1.4 |
1.1 |
1.4 |
1.5 |
|
Real
estate and business activities |
3.2 |
4.5 |
4.8 |
4.4 |
|
Public
administration and defence |
6.5 |
7.9 |
7.4 |
6.9 |
|
Education |
9.9 |
9.1 |
9.3 |
9.3 |
|
Health
care and welfare |
5.7 |
5.2 |
5.1 |
5.3 |
|
Other
services |
5.6 |
4.8 |
5.3 |
5.0 |
Source: Labour force in Latvia. Labour force survey
data, November 2000. A statistical bulletin. Central Statistical Bureau of
Latvia. Riga, March 2001.
Labour
force in Latvia. Labour force survey data, November 2001. A statistical
bulletin. Central Statistical Bureau of Latvia. Riga, March 2002.
*- data is not comparable with the previous years
|
Year |
Average
rate of registered unemployment (%) |
Rate
of job seekers to the economically active population, in November of year (%) |
||
|
|
|
Total |
Males |
Females |
|
1995 |
6.5 |
18.9 |
19.7 |
18.0 |
|
1996 |
7.0 |
18.3 |
18.9 |
17.7 |
|
1997 |
7.5 |
14.4 |
14.3 |
14.6 |
|
1998 |
7.6 |
13.8 |
13.5 |
14.1 |
|
1999 |
9.7 |
14.5 |
15.5 |
13.3 |
|
2000 |
8.5 |
14.6 |
15.6 |
13.5 |
|
2001 |
7.8 |
12.8 |
14.1 |
11.5 |
Source: CSB data and SES data
|
|
1996 |
2000 |
2001* |
||||||
|
|
Total |
Males |
Females |
Total |
Males |
Females |
Total |
Males |
Females |
|
15-24 |
29.0 |
28.1 |
30.3 |
23.6 |
21.5 |
26.4 |
20.8 |
20.3 |
21.3 |
|
25-34 |
18.7 |
17.5 |
20.1 |
13.7 |
14.9 |
12.1 |
13.1 |
14.9 |
11.1 |
|
35-44 |
15.9 |
17.7 |
14.2 |
14.2 |
14.6 |
13.9 |
11.6 |
12.9 |
10.3 |
|
45-54 |
14.9 |
16.0 |
14.0 |
14.2 |
17.9 |
11.1 |
12.7 |
14.2 |
11.4 |
|
55-64 |
17.2 |
18.6 |
14.9 |
10.1 |
11.1 |
8.7 |
9.8 |
11.0 |
8.5 |
|
65 + |
14.8 |
11.5 |
17.7 |
10.3 |
6.8 |
13.3 |
1.0 |
1.1 |
1.0 |
|
Total |
18.3 |
18.9 |
17.7 |
14.6 |
15.6 |
13.5 |
12.8 |
14.1 |
11.5 |
|
Of total
jobseekers: |
|
|
|
|
|
|
|
|
|
|
Urban
areas |
21.3 |
21.8 |
20.7 |
16.0 |
17.2 |
14.9 |
13.9 |
15.4 |
12.4 |
|
Rural
areas |
10.8 |
12.0 |
9.2 |
10.8 |
11.9 |
9.6 |
10.4 |
11.5 |
9.1 |
|
Of total
jobseekers with education: |
|
|
|
|
|
|
|
|
|
|
higher |
9.0 |
7.7 |
10.0 |
5.4 |
5.7 |
5.2 |
5.3 |
4.5 |
5.9 |
|
Secondary
incl. secondary vocational |
18.7 |
18.7 |
18.7 |
15.1 |
15.1 |
15.1 |
13.8 |
14.4 |
13.1 |
|
Basic |
25.7 |
26.2 |
24.9 |
22.3 |
24.6 |
18.2 |
17.9 |
20.0 |
14.4 |
|
Incomplete
basic |
22.5 |
27.6 |
13.9 |
27.2 |
25.1 |
29.5 |
19.1 |
27.1 |
12.1 |
Source: Labour force in Latvia. Labour force survey data, November 2000. A statistical bulletin. Central Statistical Bureau of Latvia. Riga, March 2001.
Labour force in Latvia.
Labour force survey data, November 2001. A statistical bulletin. Central
Statistical Bureau of Latvia. Riga, March 2002.
* - data is not
comparable with the previous years
|
1995 |
1998 |
1999 |
2000 |
2001 |
|
Total |
100 |
100 |
100 |
100 |
100 |
|
Of
which: |
|
|
|
|
|
|
Higher
|
7.1 |
6.8 |
6.9 |
5.9 |
7,1 |
|
Vocational
and secondary vocational |
39.1 |
38.0 |
40.6 |
33.4 |
41.8 |
|
General
secondary |
30.9 |
31.3 |
29.6 |
34.1 |
27.8 |
|
Basic,
incomplete basic |
22.9 |
23.9 |
22.9 |
26.6 |
23.3 |
Source: SES data;
Statistical Yearbook of
Latvia, 2002. - CSB. Riga, 2002.
|
|
1990 |
1995 |
1999 |
2000 |
2001 |
2002 |
|
|
Pre-school establishments |
Number of institutions |
1123 |
608 |
573 |
561 |
552 |
551 |
|
Enrolment |
111,471 |
68,490 |
65,097 |
61,759 |
61,451 |
69,194 |
|
|
General schools |
Number of institutions |
962 |
1094 |
1095 |
1074 |
1066 |
1052 |
|
Enrolment |
352,450 |
347,541 |
361,432 |
359,818 |
351,989 |
340,308 |
|
|
VET schools |
Number of institutions |
143 |
133 |
121 |
120 |
126 |
124 |
|
Enrolment |
67,409 |
42,374 |
47,703 |
48,625 |
47,627 |
46,533 |
|
|
Institutions of higher education |
Number of institutions |
10 |
28 |
33 |
33 |
36 |
37 |
|
Enrolment |
45,953 |
46,696 |
89,509 |
101,270 |
110,500 |
118,944 |
|
Source: Education Institutions in Latvia at the beginning of the school
year 2001/2002./Statistical Bulletin – Riga: CSB, 2002
Education Institutions in Latvia at the
beginning of the school year 2002/2003./Statistical Bulletin – Riga: CSB, 2003
|
|
School year
2001/2002 |
School year
2002/2003 |
||||
|
|
Number of schools |
Average number of students per school |
Ratio of teachers to students |
||
|
General schools |
1029 |
330 |
1: 10.4 |
1017 |
323 |
1:10.0 |
|
VET schools (average) |
126 |
378 |
1:8.5 |
124 |
375 |
1:8.2 |
|
VET schools by governing authority: |
|
|
|
|
|
|
|
Ministry of Education and Science |
49 |
545 |
1:11.7 |
47 |
588 |
1:13.1 |
|
Ministry of Agriculture |
36 |
365 |
1:8.8 |
35 |
374 |
1:9.0 |
|
Ministry of Welfare |
8 |
302 |
1:4.9 |
8 |
294 |
1:4.1 |
|
Municipal |
7 |
203 |
1:7.6 |
7 |
210 |
1:8.2 |
|
Ministry of Culture |
15 |
132 |
1:2.3 |
15 |
127 |
1:1.9 |
|
Private |
12 |
136 |
1:7.7 |
9 |
176 |
1:8.4 |
|
Ministry of Interior |
3 |
108 |
1:6.2 |
3 |
95 |
1:3.7 |
Source: Education institutions in Latvia at the beginning of school
year 2000/2001. Statistical bulletin - Central Statistical Bureau of Latvia.
Riga, 2001.
Education institutions in
Latvia at the beginning of school year 2001/2002. Statistical bulletin -
Central Statistical Bureau of Latvia. Riga, 2002.
Education institutions in Latvia at the beginning of the school year 2002/2003. Statistical bulletin – Central Statistical Bureau of Latvia. Riga, 2003.
|
|
2000/01 |
2002/2003 |
||||||
Total |
VET schools |
Total |
VET schools |
|||||
|
State |
Municipal |
Private |
State |
Municipal |
Private |
|||
|
Total |
5439 |
5139 |
169 |
131 |
5693 |
5325 |
179 |
189 |
|
Age: |
|
|
|
|
|
|
|
|
|
30 and younger |
870 |
795 |
337 |
38 |
823 |
759 |
29 |
35 |
|
31-39 |
1118 |
1039 |
338 |
41 |
1065 |
970 |
50 |
45 |
|
40-49 |
1682 |
1561 |
66 |
55 |
1661 |
1563 |
56 |
42 |
|
50-59 |
1255 |
1172 |
34 |
49 |
1397 |
1325 |
29 |
43 |
|
60 and elder |
657 |
619 |
11 |
27 |
747 |
708 |
15 |
24 |
|
|
|
|
|
|
|
|
|
|
|
Education: |
|
|
|
|
|
|
|
|
|
With secondary of which with
pedagogical |
1213 |
1109 |
62 |
42 |
1110 |
1028 |
54 |
28 |
|
292 |
286 |
4 |
2 |
337 |
325 |
11 |
1 |
|
|
With higher of which with higher
pedagogical |
4365 |
4073 |
124 |
168 |
4580 |
4294 |
125 |
161 |
|
3237 |
3028 |
92 |
117 |
3501 |
3273 |
97 |
131 |
|
|
Total staff with
pedagogical education |
3529 or 64.9% |
3314 or 64.5% |
96 or 56.8% |
119 or 90.8% |
3838 or 67.4% |
3598 or 67.6% |
108 or 60.1% |
132 or 69.8% |
MoES data
|
|
General schools |
VET schools |
|||
|
|
Total |
Of which: |
|
||
|
|
Grades 1-4 |
Grades 5-9 |
Grades 10-12 |
|
|
|
Total |
340308 |
103359 |
174606 |
62343 |
46533 |
|
Of which: No foreign language |
49910 |
43526 |
4711 |
1673 |
|
|
One foreign language |
144013 |
58690 |
70249 |
15074 |
40253 |
|
Two foreign languages |
137729 |
1132 |
97874 |
38723 |
15107 |
|
Three foreign languages |
8516 |
11 |
1757 |
6748 |
|
|
Four foreign languages |
140 |
- |
15 |
125 |
|
Source: Education institutions in Latvia at the beginning of the school year 2002/2003. Statistical bulletin – Central Statistical Bureau of Latvia. Riga, 2003.
|
|
Number of dropouts |
Percentage of total number of students |
ISCED level |
||
|
|
2000/2001 |
2001/02 |
2000/2001 |
2001/02 |
|
|
General schools
(grades 10 –12) |
1932 |
2003 |
3.8 |
4.1 |
ISCED 3 |
|
VET schools |
7001 |
6862 |
14.4 |
14.4 |
ISCED 2- 3 -4 |
Education institutions in
Latvia at the beginning of school year 2000/2001. Statistical bulletin -
Central Statistical Bureau of Latvia. Riga, 2001.
Education institutions in
Latvia at the beginning of school year 2001/2002. Statistical bulletin -
Central Statistical Bureau of Latvia. Riga, 2002.
|
|
Age groups |
1999/2000 |
2000/2001 |
2001/2002 |
2002/2003* |
|
Second stage of basic education (ISCED – 2) |
11 – 15 |
80.6 |
85.5 |
88.7 |
88.6 |
|
Secondary education (ISCED – 3) |
16 – 18 |
70.3 |
71.1 |
70.6 |
70.8 |
|
First stage of tertiary education (ISCED – 5) |
19 – 23 |
26.4 |
29.3 |
31.6 |
34.0 |
Source: Education institutions in Latvia at the beginning of school
year 1999/2000. Statistical bulletin - Central Statistical Bureau of Latvia.
Riga, 2000
Education institutions in
Latvia at the beginning of school year 2000/2001. Statistical bulletin - Central
Statistical Bureau of Latvia. Riga, 2001.
Education institutions in
Latvia at the beginning of school year 2001/2002. Statistical bulletin -
Central Statistical Bureau of Latvia. Riga, 2002.
Education
institutions in Latvia at the beginning of the school year 2002/2003.
Statistical bulletin – Central Statistical Bureau of Latvia. Riga, 2003.
* - Provisional data of the population are used
|
Age |
General schools |
VET schools |
Institutions of higher education |
|||
|
|
2001/02 |
2002/03 |
2001/02 |
2002/03 |
2001/02 |
2002/03 |
|
14 years |
36868 |
35877 |
89* |
70* |
|
|
|
15 years |
35634 |
35641 |
1641 |
944 |
|
|
|
16 years |
26216 |
27860 |
9158 |
8619 |
|
|
|
17 years |
22517 |
22743 |
11260 |
10932 |
188* |
310* |
|
18 years |
10034 |
10926 |
10345 |
10411 |
8290 |
7874 |
|
19 years |
3229 |
3582 |
6545 |
6953 |
11740 |
13160 |
|
20 years |
1411 |
1389 |
3042 |
3211 |
11909 |
12887 |
|
21 years |
1031 |
989 |
1492 |
1529 |
11178 |
11766 |
|
22 years |
3324** |
3492** |
843 |
876 |
9187 |
9922 |
|
23 years |
|
|
3212** |
2988** |
7393 |
7872 |
|
24 years |
|
|
|
|
5720 |
5854 |
*the given age and younger
** the given age and older
Source: Education institutions in Latvia at the beginning of school
year 2001/2002. Statistical bulletin - Central Statistical Bureau of Latvia.
Riga, 2002.
Education Institutions in Latvia at the
beginning of the school year 2002/2003./Statistical Bulletin – Riga: CSB, 2003
|
|
1998 |
1999 |
2000 |
2001 |
|
Unemployment benefits |
14.7 |
27.5 |
21.5 |
18.4 |
|
Stipends for unemployed |
0.7 |
0.8 |
0.6 |
0.8 |
|
Other employment measures |
4.4 |
5.3 |
4.6 |
4.5 |
|
Payments for pensions insurance |
2.4 |
5.2 |
4.6 |
4.7 |
|
Administrative costs |
0.6 |
0.5 |
0.5 |
0.5 |
|
Other expenditures |
3 |
3.6 |
0 |
0.03 |
Source: Social insurance in Latvia / Figures and facts 2001 – Riga: SSIA, 2002.
|
Year |
Persons receiving unemployment benefit |
Average amount of unemployment benefit ( |
|
1999 |
572,886 |
48.07 |
|
2000 |
477,414 |
43.30 |
|
2001 |
454,923 |
40.55 |
Source: Social insurance in Latvia / Figures and facts 2001 – Riga: SSIA, 2002.
|
|
1999 |
2000 |
2001 |
2002 |
2003 |
|
Insurance for state pensions |
27.91% |
27.10% |
26.93% |
27.10% |
25.59% |
|
Insurance for the case of unemployment |
2.34% |
2.45% |
2.20% |
1.90% |
1.94% |
|
Insurance against accidents at work |
0.09% |
0.09% |
0.09% |
0.09% |
0.09% |
|
Disability insurance |
4.67% |
4.16% |
3.89% |
3.76% |
3.31% |
|
Maternity and sickness insurance |
2.08% |
2.29% |
1.98% |
2.24% |
2.16% |
|
Total rate of social contribution payment |
37.09% |
36.09% |
35.09% |
35.09% |
33.09% |
Source: Cabinet of Ministers Regulations on Mandatory contribution payment rates by the kind of state social insurance
The
Law “On Insurance in the Case of Unemployment” prescribes that the amount of the
unemployment benefit is calculated in proportion to the length of the insurance
period and according to incomes from which contribution payments are made for
the case of unemployment:
1)
from 1 to 9 years – 50 % of the average insurance contribution payment salary;
2)
from 10 to 19 years – 55 % of the average insurance contribution payment
salary;
3)
from 20 to 29 years – 60 % of the average insurance contribution payment
salary;
4)
more than 30 years – 65 % of the average insurance contribution payment salary.
The
above unemployment benefit is paid depending on the length of the unemployment
period:
during the first three months it is paid in
full
from three to six months – 75 % of the
established unemployment benefit
from
six to nine months – 50% of the established unemployment benefit
As of
November 2002 there are no any restrictions on the amount of the unemployment
benefit
The
registered unemployed has rights to receive unemployment benefit if social
insurance contributions are paid at least 9 months within last 12 months. The
unemployment benefit could be received 9 months during the period of 12 months
after it is granted.
Correlation of the goals of the Concepts of Education Development and the directions of action
|
Common goal |
Ensure changes in the system of education to promote
the formation of a democratic and socially integrated society based on
knowledge and the raising of competitivity of Latvian population and national
economy, and simultaneously to preserve and develop cultural values that are
typical of Latvia. |
||
|
Goal |
Education quality |
Accessibility of education |
Cost-effectiveness of education |
Directions of action
|
- conclusion of the evaluation system of the basic and secondary education system - improvement of the system of teacher education and further education of teachers - quality assurance of vocational education to meet the requirements of the labour market - quality assurance of higher education to meet the requirements of the labour market - setting up of a single system for the assessment of education quality - continuation of
the teacher remuneration reform - renewing of the
research and academic staff - introduction of
a education system indicators comparable at the international level - informatisation of the education system - promotion of public understanding of education development processes - further development of education communications |
-
improvement
of the system of pre-school education - diminishing of differences in access to quality general education - improvement of access to vocational education - improvement of adult education opportunities by offering vocation-focused life-long education - increase of access to interest-related education - promotion of integration of educatees with special needs in general, vocational, higher and interest-related education programmes |
- optimisation of the network of general education establishments - increase of cost-effectiveness of educational establishment maintenance - provision of a single education system administration - development of the regulatory principles of financing of education and ensuring transparency of the utilisation of resources - provision of the development of the higher education financing system |
NON PROFIT ORGANIZATION
STATE JOINT STOCK COMPANY
STATE EMPLOYMENT SERVICE

Employment State Service - Riga Centre


![]()


![]()

On
[1] During 1999 – 2003 the rate of contribution payment remained unchanged for employees and was 9%. The rate of contribution payment for employers reduced from 28.09% to 24.09%.